For this week’s exercise, I created a map overlaying two separate maps, which can be found at the following two links:
Map of Israeli Settlements as of 1993
Map of Palestinian Refugee Camps as of 2012
For this map, I was trying to compare the number and location of Israeli Settlements created as of the 1993 Oslo Accords and the Palestinian Refugee Camps created as a result up to the year 2012. The following images of the created map show the location of the camps with yellow push-pin icons and the settlements as blue dots.
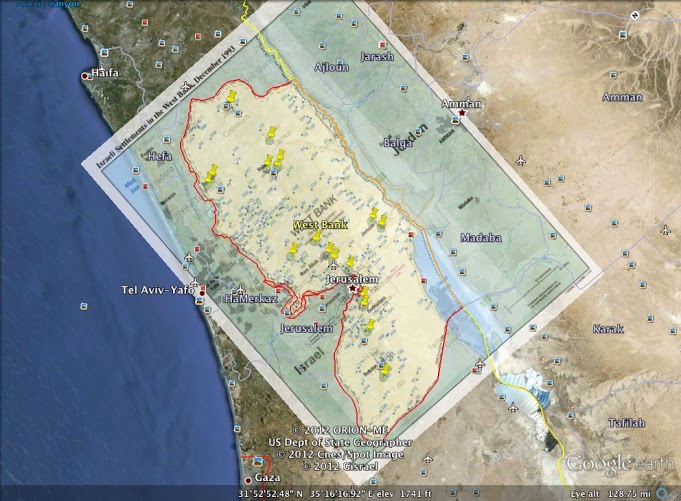 The image above is an arial-like view of the map, showing a broad view of the West Bank.
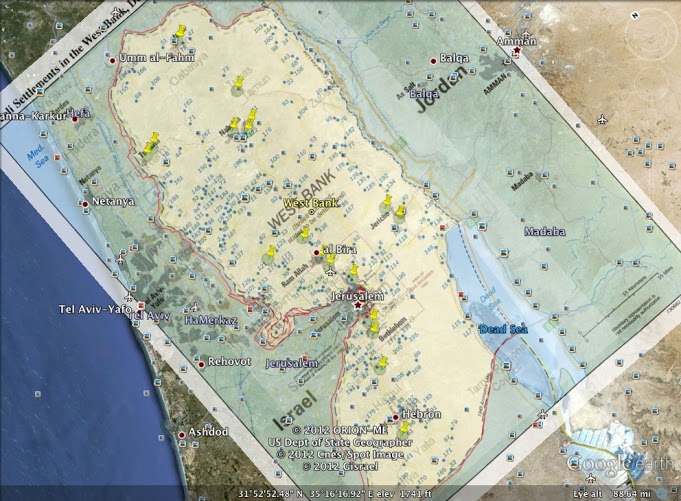 The above image is a close-up of the West Bank map displayed previously, showing more clearly the clusters of settlements and refugee camps.
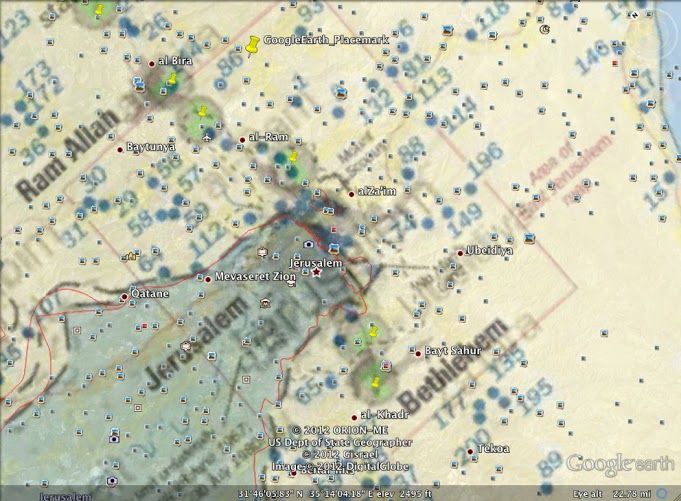 The above image is a close up on the area of Ramallah, Jerusalem, and Bethlehem, three cities that are central for both the Israeli and Palestinian people. Comparing this image with the others, it is clear that the number of settlements increases, in some cases encircling or blocking off refugee camps from one another.
For the process of creating this map, I first thought through what I wanted to display to my audience. I had initially decided on showing the increase of settlements from 1993 to 2012, but could not find any concrete data that would be well displayed on a map. I decided instead to show the correlation and comparison between the number of settlements and refugee camps.
Once I had decided what information I wanted to display on my map, I found a separate map that displayed each aspect of what I wanted to show (the links for which are shown above). I first used the image overlay tool to display the first image, showing the Israeli settlements in blue dots. After I positioned the map and adjusted the translucency of the image, I worked on overlaying the second image, which displayed the location and number of the refugee camps. After I finished overlaying the image, I saw that the contrast between the two images was not very clear, and the refugee camps and settlements did not stand apart from one another on the map. Searching around the Google Earth tools for a bit, I found a push-pin tool that allowed to to show the location of the refugee camps in a way that would make them stand out from the other icons displayed on the map, resulting in the map images displayed above.
Overall, the Google Earth program was fun to use and explore. and allowed me to create many of the maps that I have seen before on other websites. I look forward to using it in the future and developing more skills through this class.